At work I finally got around to doing a project I’ve been wanting to do for a long time: analyze the sharing behavior of a year’s worth of content at Mashable.
It’s no small project. First, a year’s worth of Mashable content must be collected, which ended up being 13,979 articles in total. Next, the author, publish date, headline, and full text of each post must be extracted from each page, which requires a (fortunately simple) custom scraper to be built. Next, the social resonance data of each article must be collected. For this analysis, I collected share counts for Twitter, Facebook, StumbleUpon, LinkedIn, Google+, and Pinterest, plus clicks from Bitly and per-article submissions from Reddit.
Once all that data has been collected and structured, it must be analyzed. I found good ol’ Excel pivot tables to be perfect for most of the analysis. Tracking mentions of key topics from the past year, like Gangnam Style, requires the ability to do full-text searches against headlines and article content, so I indexed all of the data from above into ElasticSearch. It performed brilliantly.
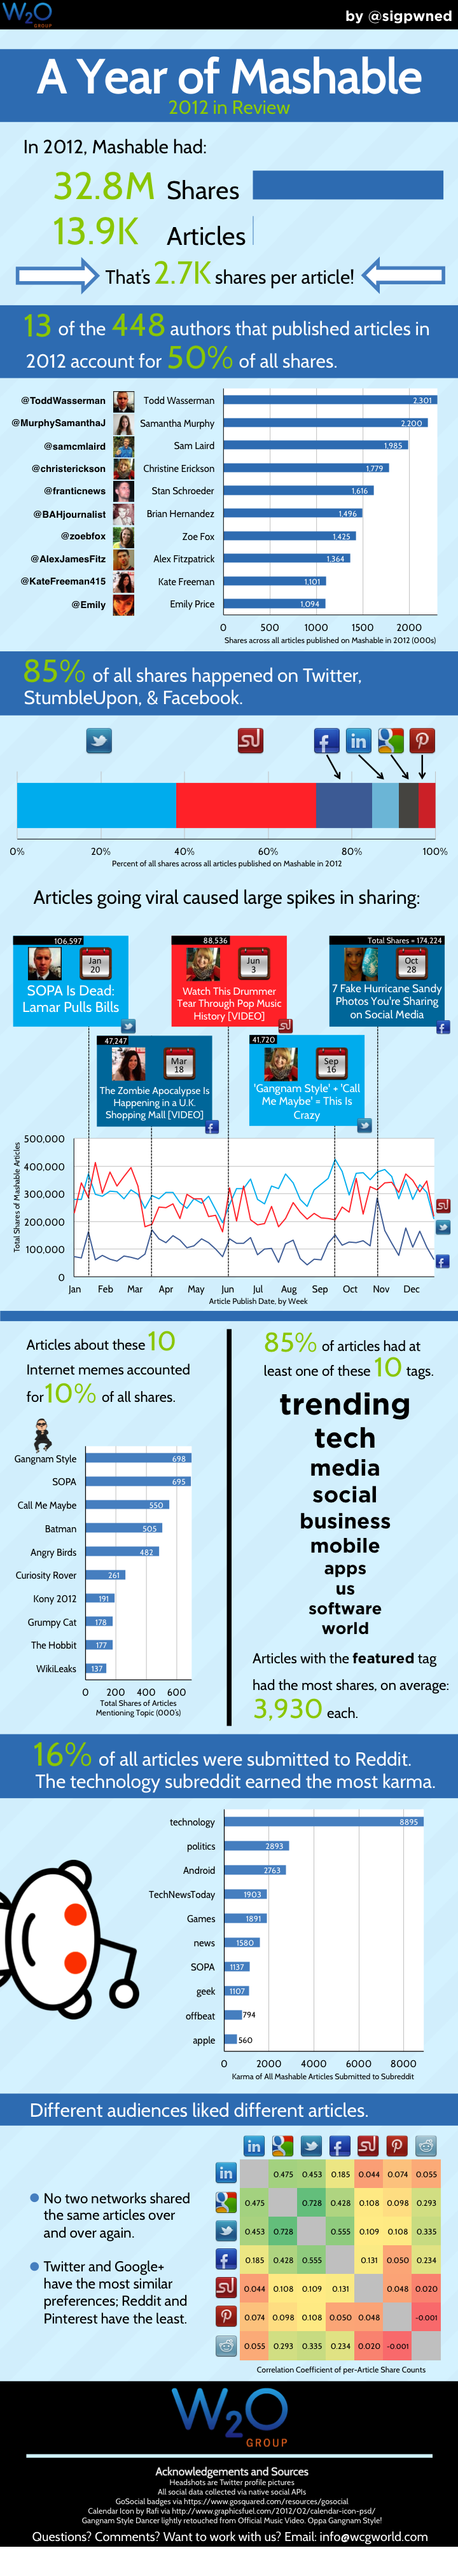
I ended up making an infographic out of the data, and I posted it to the corporate blog of the company I work for. I’m proud of it, so I’m posting it here too.
By no means the finest infographic ever made, but hopefully not the worst one, either. Enjoy!